Benchmark falls deepened losses, but multi-asset and debt cushioned portfolios meaningfully

January 2026 extended the market correction into a second straight month, with sharp swings and weak breadth. The Nifty 50 TRI fell 3.04% and the S&P BSE 500 TRI dropped 3.34%, as most sectors ended lower; only metals (+6%), PSU banks (+6%) and technology (+0.4%) closed in the green, while real estate (-11%) and consumer (-8%) led declines ahead of Union Budget. Domestic flows stayed supportive, with DII inflows robust, but FIIs recorded outflows for the second consecutive month, and India underperformed key global markets.
Against this backdrop, the PMS Bazaar snapshot tracked 453 equity PMS strategies, where the month was decisively risk-off: just 47 strategies delivered positive returns and the equity average return came in at -3.32%. Diversifiers held up better. Among 33 multi-asset strategies, 18 were positive and the category average was +0.81%. Debt strategies also stayed steady, with 14 of 17 in the green and an average +0.16%, while three-scheme hybrid category averaged +0.74%.
Even with benchmarks down over 3%, outcomes were far from uniform: the best-performing strategies delivered double-digit gains, and the overall top 10 included a mix of equity, multi-asset and hybrid approaches. This highlights how positioning and mandate can widen the gap between portfolios when the market tape turns hostile.
One more pattern worth flagging is the shape of outcomes across buckets. Equity wasn’t just negative on average; it was lopsided, with barely about a tenth of strategies in the green. This suggests the month punished broad beta and left little room for “average” portfolios to hide. In contrast, multi-asset and hybrid staying positive on average hints that rebalancing, carry, and cross-asset offsets mattered more than pure stock selection. Debt’s small positive average also fits a “risk-off cushion” role; those returns won’t excite, but they can stabilise month-to-month drawdowns.
Here is a more detailed review of January-2026 return across PMS strategies.
Top-10 Performers
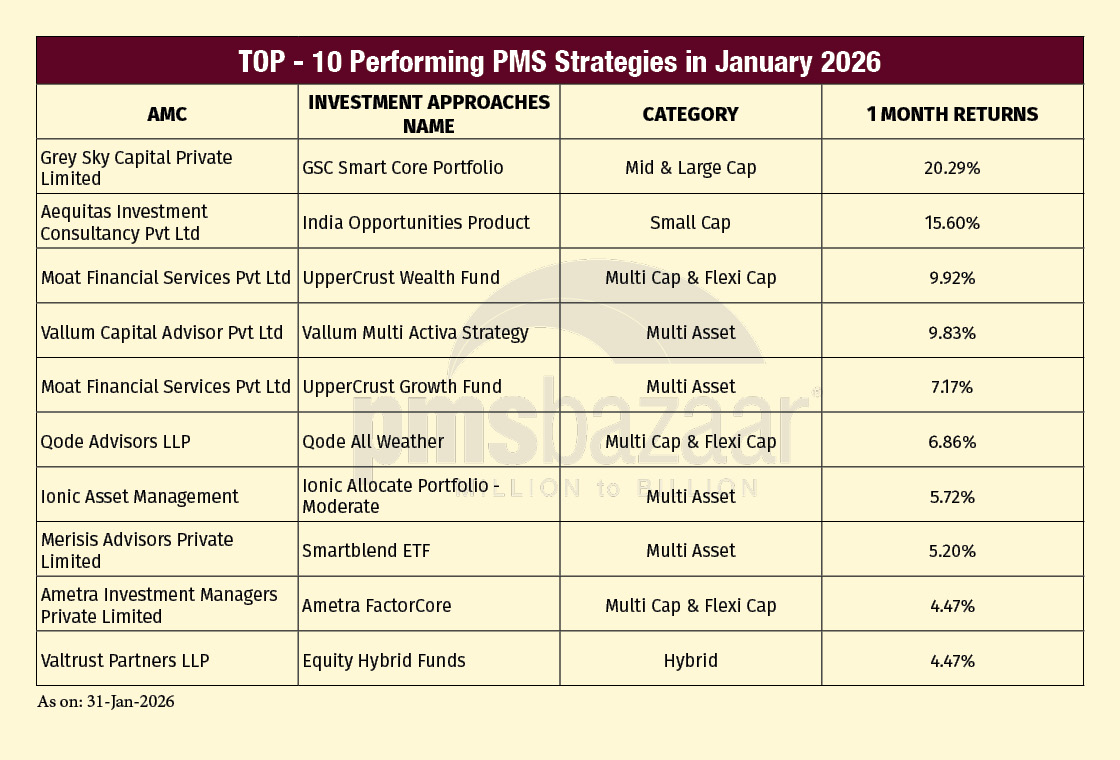
Grey Sky Capital Private Limited’s GSC Smart Core Portfolio led the month with 20.29%. It was followed by Aequitas Investment Consultancy India Opportunities Product at 15.60% and Moat Financial Services UpperCrust Wealth Fund at 9.92%. Vallum Capital Advisor’s Vallum Multi Activa Strategy returned 9.83%, while Moat Financial Services UpperCrust Growth Fund delivered 7.17%. Qode Advisors LLP’s Qode All Weather posted 6.86%. Ionic Asset Management’s Ionic Allocate Portfolio – Moderate returned 5.72%, and Merisis Advisors Private Limited’s Smartblend ETF gained 5.20%. Ametra Investment Managers Private Limited’s Ametra FactorCore and Valtrust Partners LLP’s Equity Hybrid Funds both returned 4.47%.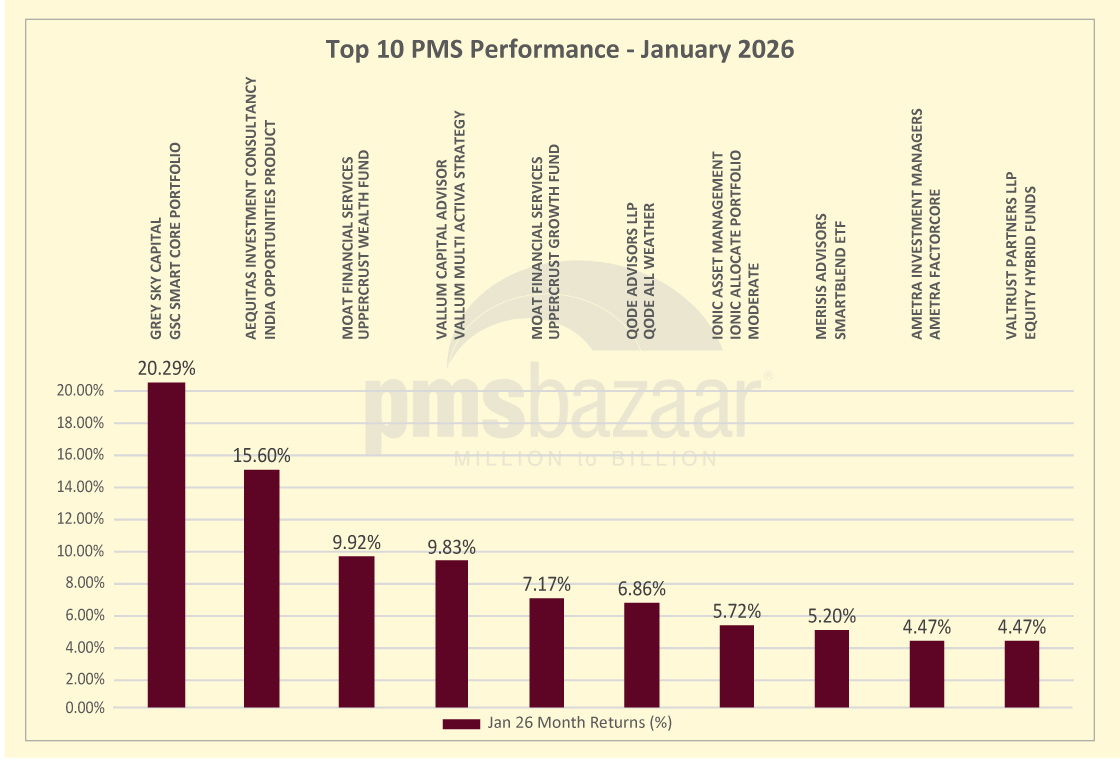
The top-10 underlines just how non-linear outcomes were in January. The spread between the #1 strategy (20.29%) and the #10 (4.47%) is 15.82 percentage points. This is a huge range for a single month, especially when broad indices were down about 3%. Leadership was also not confined to one mandate. Five of the top 10 are multi-asset/hybrid (four multi-asset plus one hybrid), while five are equity. That suggests the month rewarded both tactical diversification and selective equity positioning, rather than a single “right” style.
Within equities, winners were concentrated in Mid & Large, Small Cap, and Multi/Flexi Cap categories. That mix hints at portfolios that either leaned into specific opportunity sets or were able to sidestep the broad-market drag captured by Nifty 50 TRI and BSE 500 TRI benchmarks. Multi-asset strategies, meanwhile, show up repeatedly with different reference indices, including a hybrid composite benchmark, implying varied construction frameworks even within the same category.
Here is a table of the top-10 performers.
PMS Category Scan
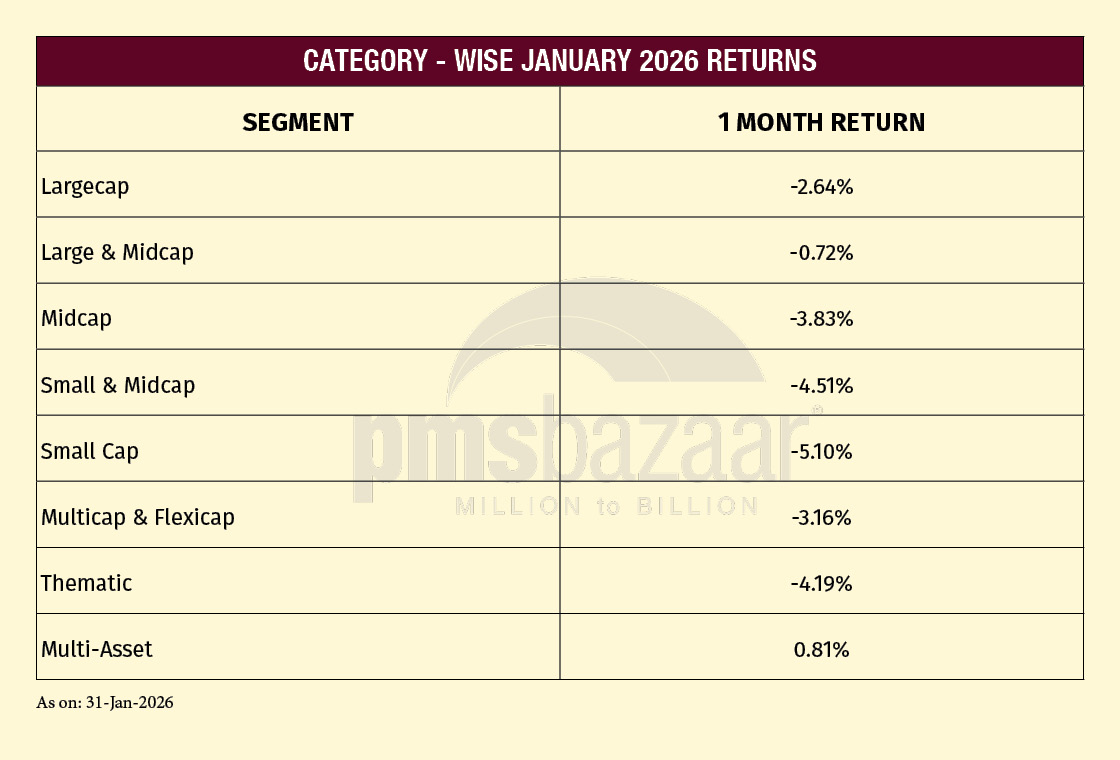
January 2026’s category-wise PMS returns sharpen the gap between diversified mandates and most equity-heavy styles. Multi-Asset was again the only segment with a positive average return, at 0.81%, standing out in a month when headline indices fell over 3%. Among equity categories, Large & Midcap was the most resilient at -0.72%, indicating that blended exposure held up relatively better than more style-specific buckets.
Losses deepened as mandates moved away from broader mixes. Largecap strategies averaged -2.64%, while Multicap & Flexicap came in at -3.16%, broadly tracking the market’s downdraft. The pressure intensified in more concentrated or higher-beta segments: Midcap averaged -3.83% and Thematic -4.19%, pointing to sharper drawdowns when leadership narrowed and volatility rose.
At the lower end, the month’s weakest averages were in smaller-cap tilted categories. Small & Midcap strategies averaged -4.51%, and Small Cap was the softest at -5.10%.
The ranking matters as much as the absolute figures: January’s pattern is a clear “risk-off” ladder. Returns deteriorate as portfolios tilt from diversified allocations toward narrower, smaller-cap exposures.
Multi-Asset PMS Strategies
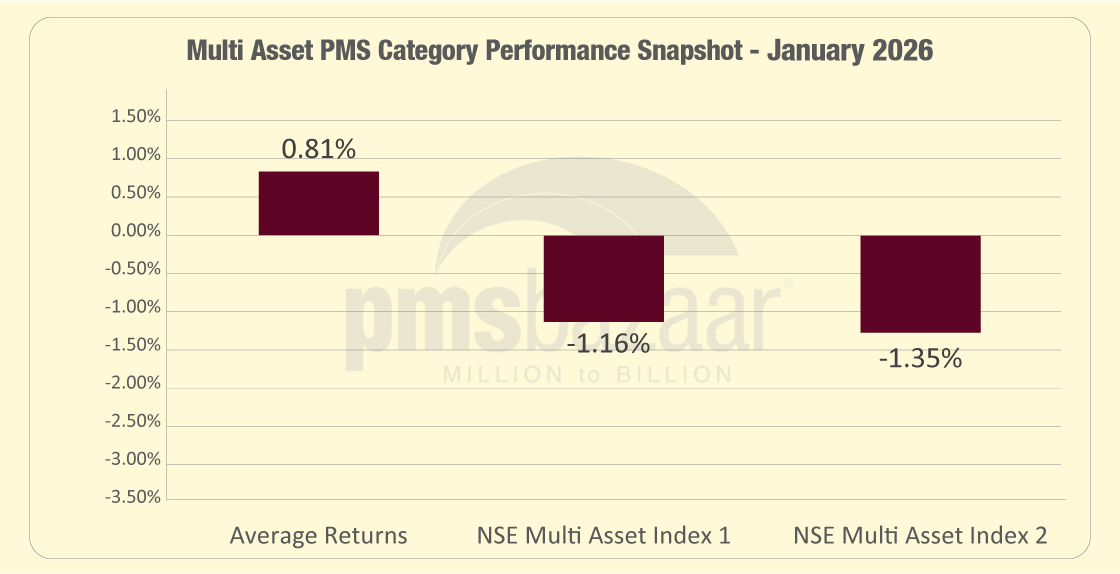
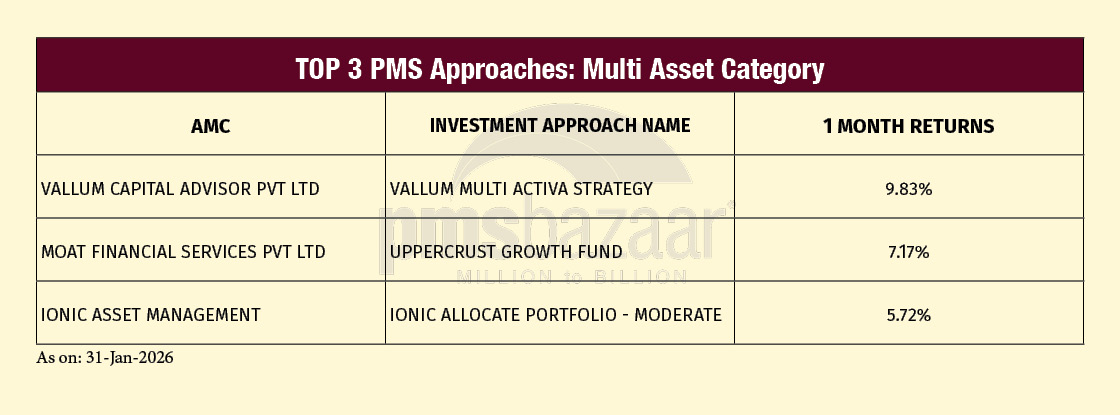
Multi-asset PMS strategies again stood out in January 2026, delivering positive average returns despite a weak month for risk assets. Across 33 schemes tracked, the category posted an average return of 0.81%. That is notable because both reference indices in this bucket were negative: NSE Multi Asset Index 1 fell 1.16% and NSE Multi Asset Index 2 declined 1.35%. On outperformance counts, 22 of 33 schemes finished ahead of Index 1, and 25 of 33 beat Index 2, indicating that a clear majority stayed ahead of their stated yardsticks even as broader market conditions deteriorated.
Within the category, the leaders created a wide gap over the rest. The top strategy i.e. Vallum Multi Activa returned 9.83%, followed by Moat Financial Services UpperCrust Growth Fund at second with 7.17% and Ionic Asset Management’s Ionic Allocate Portfolio - Moderate at third with 5.72%.
In a way, January reinforced the core point of the bucket: when markets are down and dispersion rises, multi-asset portfolios can still deliver a smoother return profile. In many cases this month, offerings even outperformed negative return multi-asset indices.
Here is a table on the top performers in this category.
Large & Midcap PMS Strategies
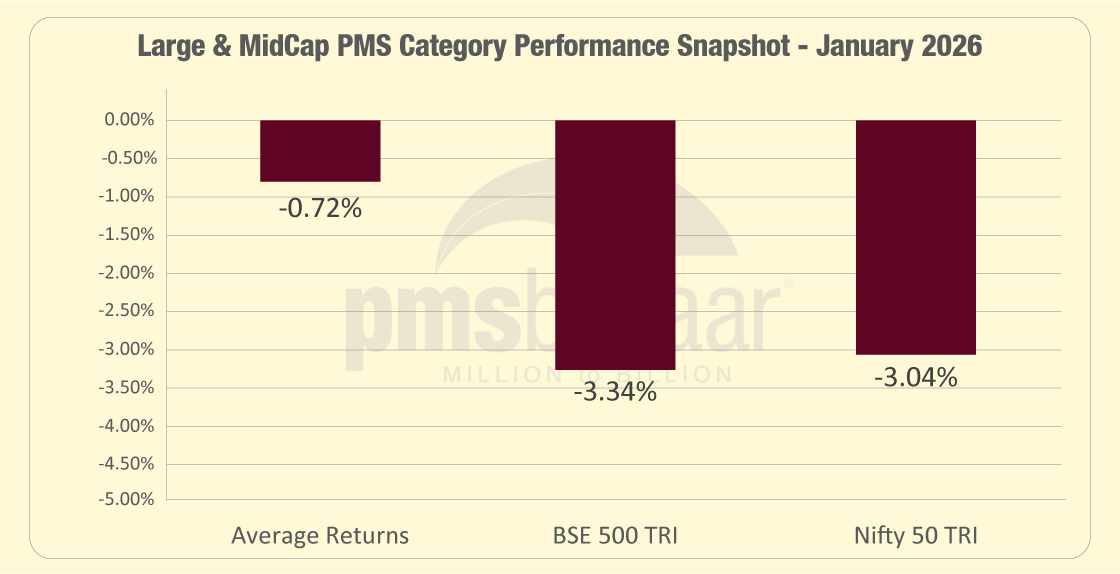
Large & Midcap PMS strategies were the most resilient among equity buckets in January 2026, limiting losses even as the broader market corrected. Across 24 schemes tracked, the category delivered an average return of -0.72%, a markedly smaller drawdown than the S&P BSE 500 TRI (-3.34%) and the Nifty 50 TRI (-3.04%).
On an outperformance count, 17 of 24 schemes finished ahead of the BSE 500 TRI and 16 beat the Nifty 50 TRI. This shows that a clear majority in this segment protected relative performance during the month’s sell-off.
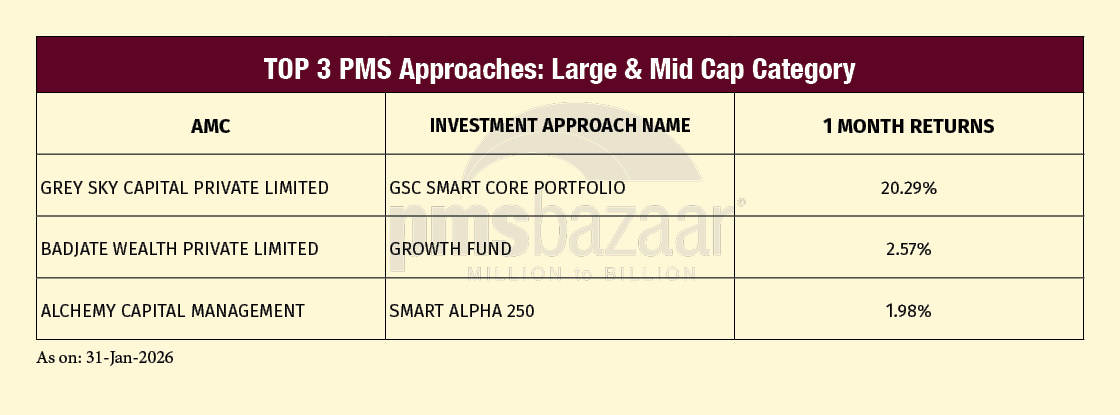
Within the category, Grey Sky Capital’s GSC Smart Core Portfolio (20.29%) pulled far ahead of the pack, a clear outlier versus both benchmarks .Returns clustered in the low single digits, with Badjate Wealth’s Growth Fund up 2.57% and Alchemy Capital’s Smart Alpha 250 gaining 1.98% for the period.
Overall, January’s pattern suggests that this blended segment not only cushioned downside on average, but also delivered a wide spread between the best and the rest. This highlights how manager positioning can dominate outcomes even within the same category.
Here is a table on the top performers in this category.
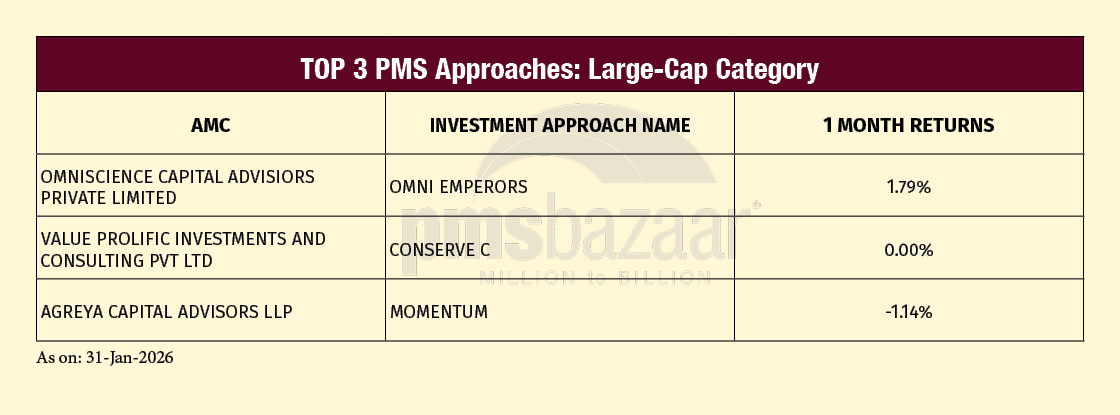
Large Cap PMS Strategies
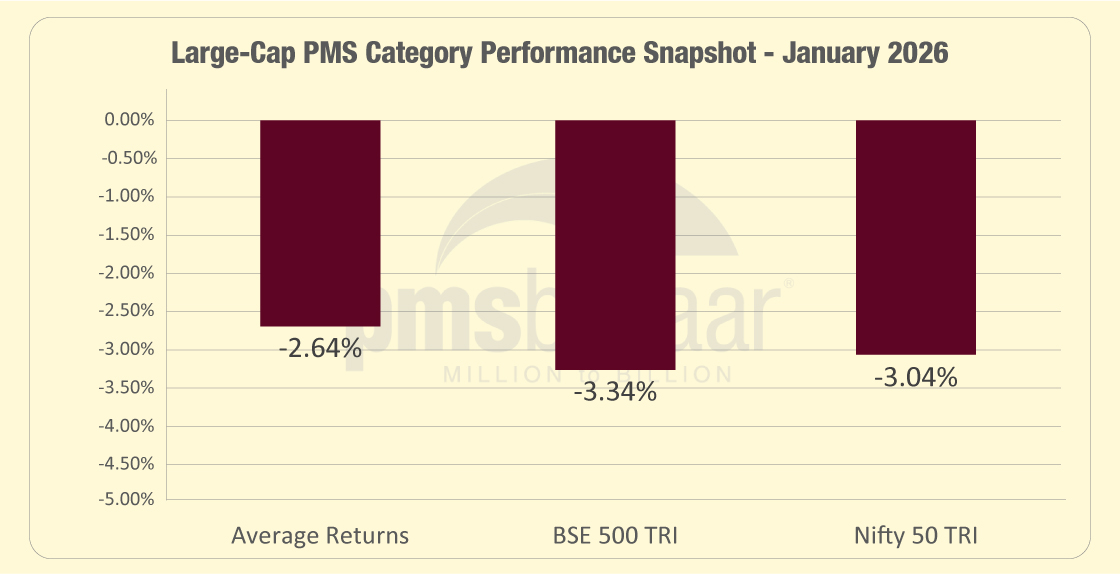
Large-cap PMS strategies tracked the market’s risk-off tone in January 2026, but still managed relative resilience versus the broader indices. Across 31 schemes tracked, the category delivered an average return of -2.64%, which was better than the S&P BSE 500 TRI (-3.34%) and also ahead of the Nifty 50 TRI (-3.04%).
Outperformance counts support that: 22 of 31 strategies beat the BSE 500 TRI and 21 finished ahead of the Nifty 50 TRI, indicating that most large-cap PMS portfolios limited damage versus their benchmarks during the month.
At the top end, Omniscience Capital’s Omni Emperors (1.79%) was the standout, ending the month positive despite the index drawdown. Value Prolific’s Conserve C (0.00%) also held flat, and Agreya’s Momentum declined 1.14% for the period.
January’s large-cap bucket reads as “contained drawdown” rather than “escape velocity”: plenty of relative outperformance, but only a narrow slice of strategies managing to stay at or above zero.
Here is a table on the top performers in this category.
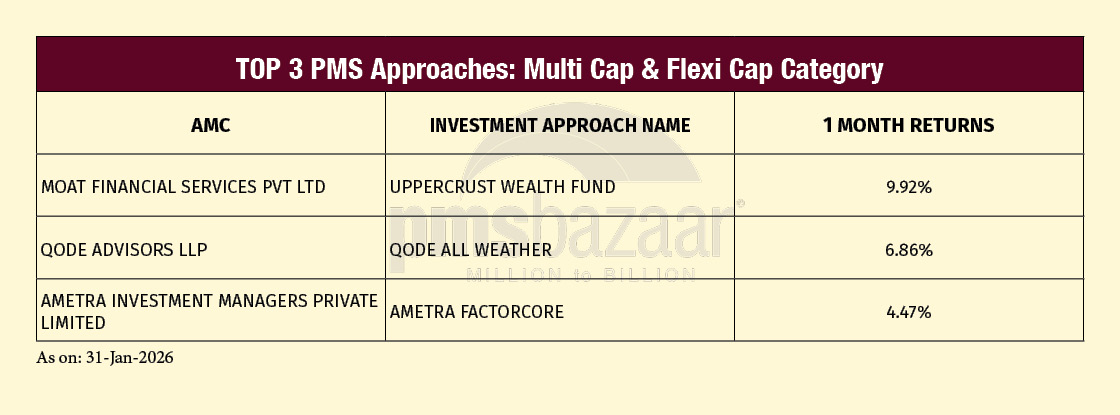
Multi & Flexicap PMS Strategies
Multi & Flexicap PMS strategies formed the largest bucket in the January 2026 snapshot, and their aggregate outcome closely mirrored the market’s decline.
Across 267 schemes tracked, the category posted an average return of -3.16%. This slightly better than the S&P BSE 500 TRI (-3.34%), but marginally below the Nifty 50 TRI (-3.04%).
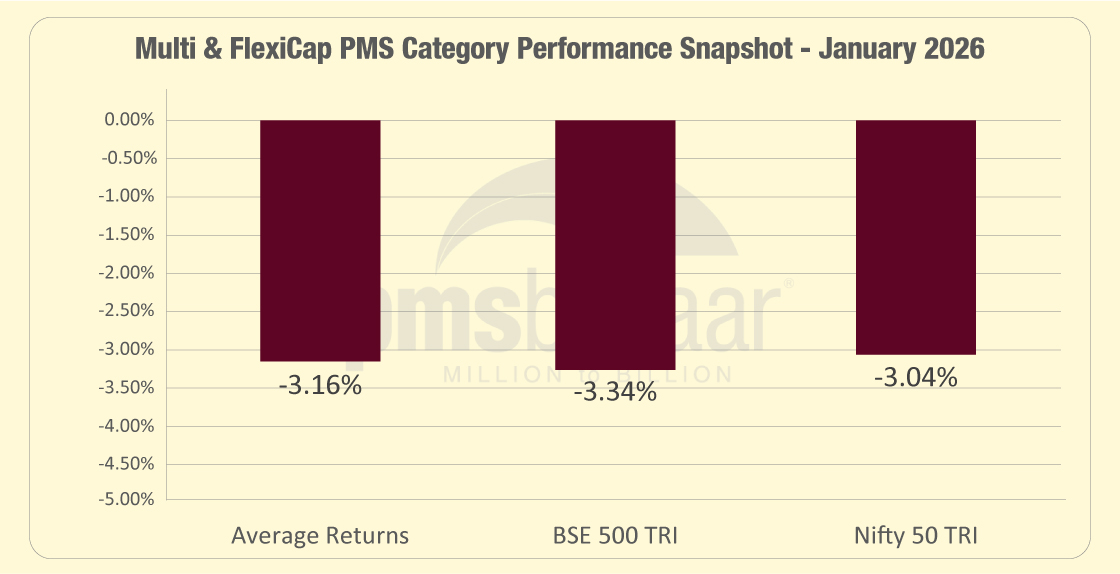
The outperformance counts show how tight this was: 140 of 267 strategies finished ahead of the BSE 500 TRI, while 117 beat the Nifty 50 TRI. In other words, this category delivered near-index-like month-to-month results in aggregate, with roughly half the universe managing to stay ahead of the broader-market yardstick.
Within the bucket, however, dispersion was clearly visible at the top end. Moat Financial Services’ UpperCrust Wealth Fund (9.92%) led the table, followed by Qode Advisors’ Qode All Weather (6.86%).Ametra’s FactorCore posted a gain of 4.47% for the period, marking a mid-single-digit advance.
January’s read-through is that this broad, flexible bucket did not escape the market downdraft on average. But, it still produced a meaningful set of positive-return strategies at the top, underscoring the wide spread in portfolio outcomes even within the same category.
Here is a table on the top performers in this category.
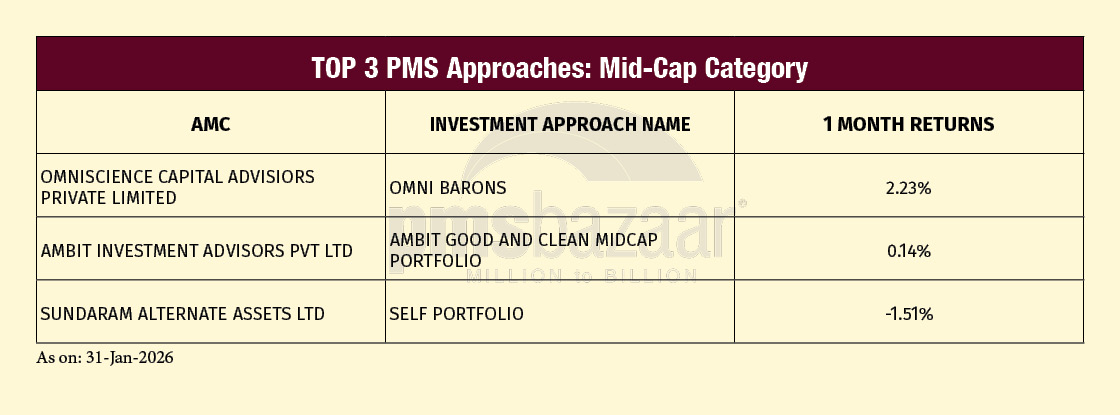
Midcap PMS Strategies
Midcap PMS strategies were under sharper pressure in January 2026, with the category averaging a deeper drawdown than the headline indices.
Across 22 schemes tracked, the segment posted an average return of -3.83%, versus -3.34% for the S&P BSE 500 TRI and -3.04% for the Nifty 50 TRI.
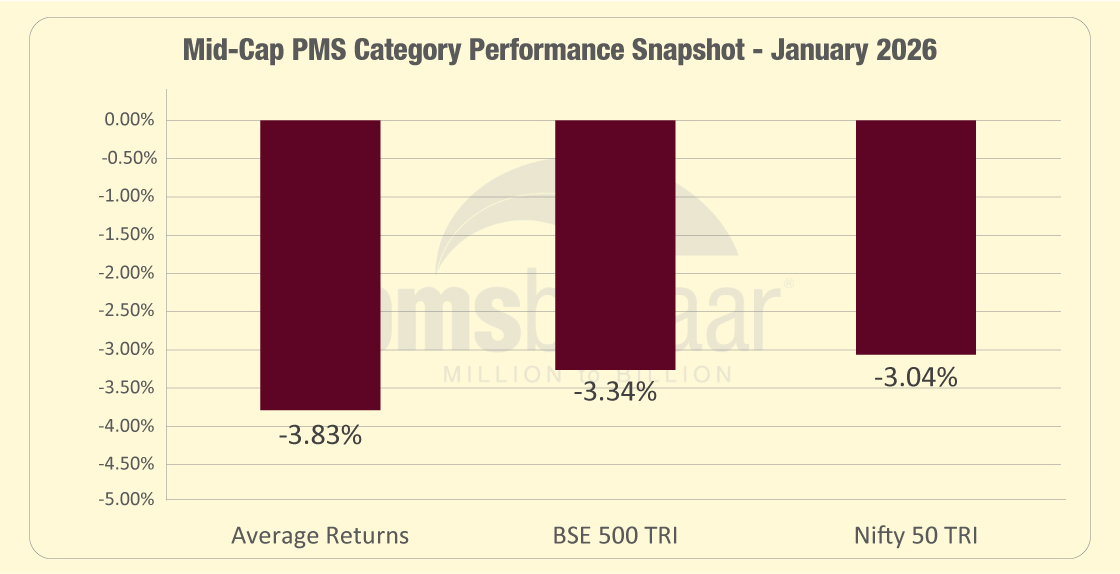
Outperformance was therefore harder to come by: only 8 of 22 strategies beat the BSE 500 TRI, and 7 finished ahead of the Nifty 50 TRI. This performance makes this one of the weaker equity buckets on both absolute returns and relative hit-rate.
The top of the table shows that positive outcomes were still possible, but they were scarce. Omniscience Capital’s Omni Barons (2.23%) led the category, with Ambit’s Good and Clean Midcap Portfolio (0.14%) the only other strategy in the top list to end non-negative.Thereafter, the return profile slipped into losses, though initially moderate, with Sundaram Alternate Assets’ SELF Portfolio declining (1.51%) for the period.
January’s midcap bucket reads as a month where the downside was broad-based and only a small slice of strategies managed to stay ahead of the index drawdowns.
Here is a table on the top performers in this category.
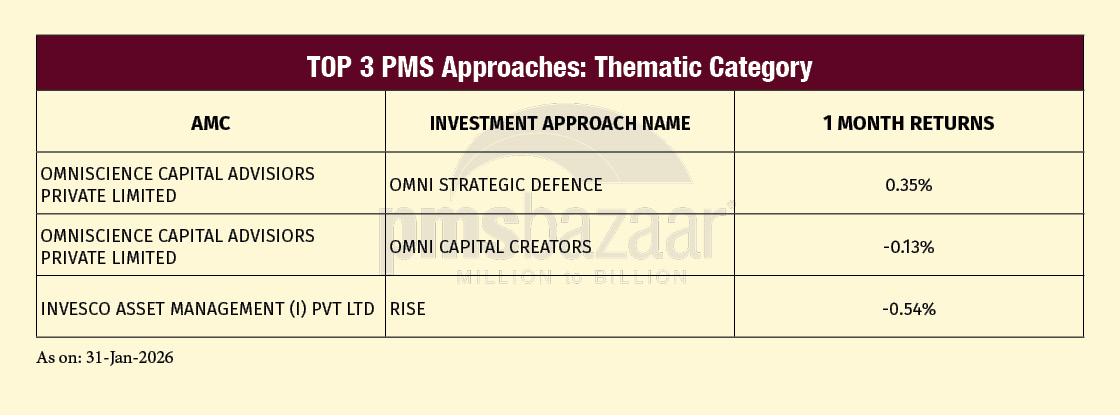
Thematic PMS Strategies
Thematic PMS strategies had a tough January 2026, with the category registering a sharper drawdown than the broader indices. Across 23 schemes tracked, the segment posted an average return of -4.19%, worse than the S&P BSE 500 TRI (-3.34%) and the Nifty 50 TRI (-3.04%). Consistent with that, outperformance was limited: only 9 of 23 strategies beat the BSE 500 TRI and 8 finished ahead of the Nifty 50 TRI. This shows that this bucket, by design narrower in exposure, struggled to keep pace in a risk-off month.
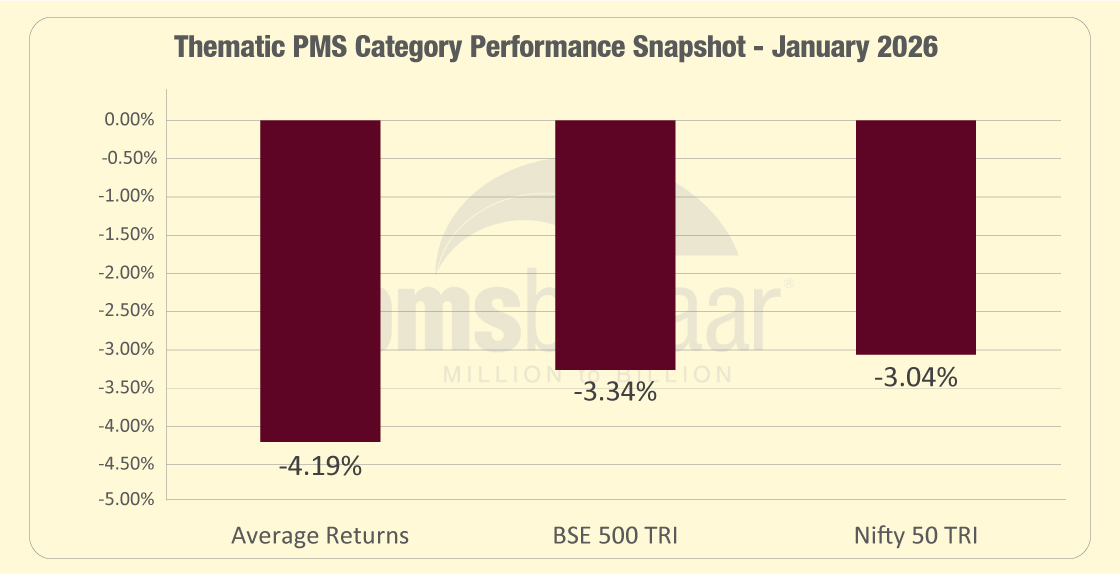
At the top end, there were a few strategies that held up far better than the averages. Omniscience Capital’s Omni Strategic Defence (0.35%) was the only entry in the top list to end positive. It was followed by Omniscience Capital’s Omni Capital Creators (-0.13%), which was close to flat.Invesco’s RISE recorded a relatively limited decline of 0.54% for the period.
Overall, January reinforces the trade-off in thematic mandates: they can differentiate strongly, but in months where the tape turns broadly negative, the category average can undershoot diversified equity buckets.
Here is a table on the top performers in this category.
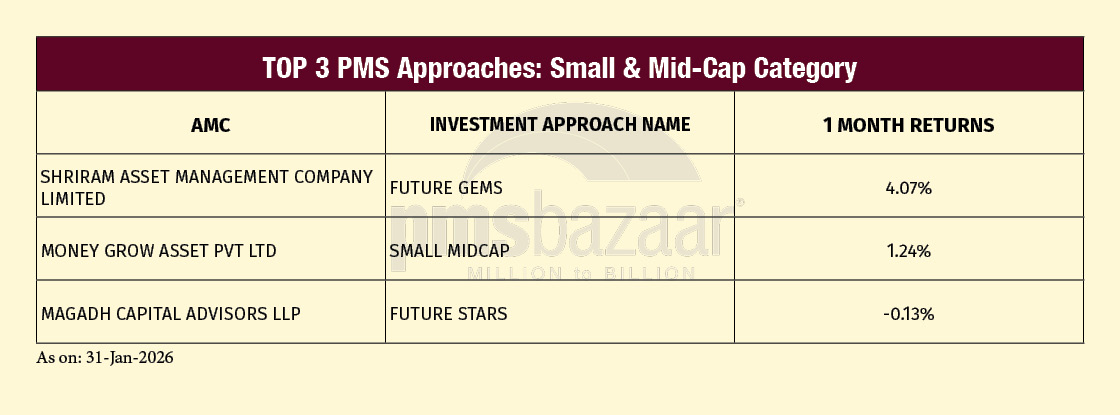
Mid & Smallcap PMS Strategies
Mid & Smallcap PMS strategies were among the weaker equity buckets in January 2026, reflecting the month’s clear risk-off bias against smaller market-cap exposure.
Across 54 schemes tracked, the category posted an average return of -4.51%, notably worse than the S&P BSE 500 TRI (-3.34%) and the Nifty 50 TRI (-3.04%). Outperformance counts were correspondingly thin: only 17 of 54 strategies beat the BSE 500 TRI and 16 finished ahead of the Nifty 50 TRI. This brings to the fore the fact that most portfolios in this segment struggled to keep pace with the broader benchmarks.
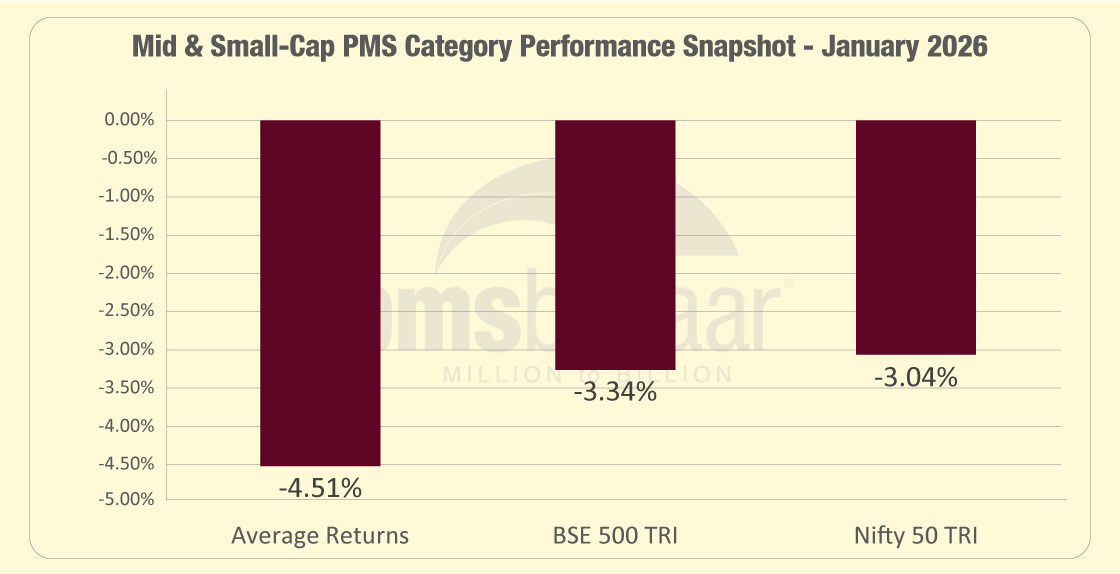
The top of the table shows a wide split even within this pressured bucket. Shriram AMC’s Future GEMS (4.07%) led the category with a strong positive month, followed by Money Grow Asset’s Small Midcap (1.24%). Thereafter, returns quickly converged toward flat-to-negative territory, with Magadh Capital’s Future Stars posting a marginal decline of 0.13%.
Overall, January’s read-through is that while the bucket’s average return was dragged down by broad weakness, the top cohort still managed to contain losses or even deliver gains. This showes dispersion remains alive even when the segment direction is firmly negative.
Here is a table on the top performers in this category.
Smallcap PMS Strategies
Smallcap PMS strategies were the weakest equity bucket in January 2026, reflecting how sharply risk appetite faded for smaller names during the month.
Across 26 schemes tracked, the category posted an average return of -5.10%, materially worse than the S&P BSE 500 TRI (-3.34%) and the Nifty 50 TRI (-3.04%).
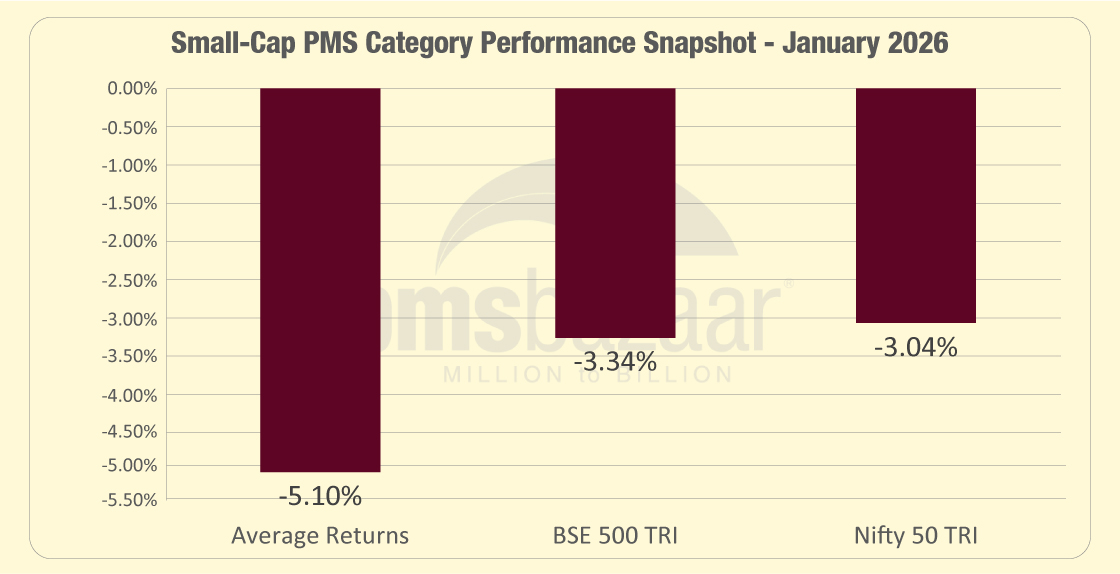
The outperformance math underlines how difficult the month was: only 3 of 26 strategies beat the BSE 500 TRI and the same 3 finished ahead of the Nifty 50 TRI. This is also one of the lowest hit-rates across categories.
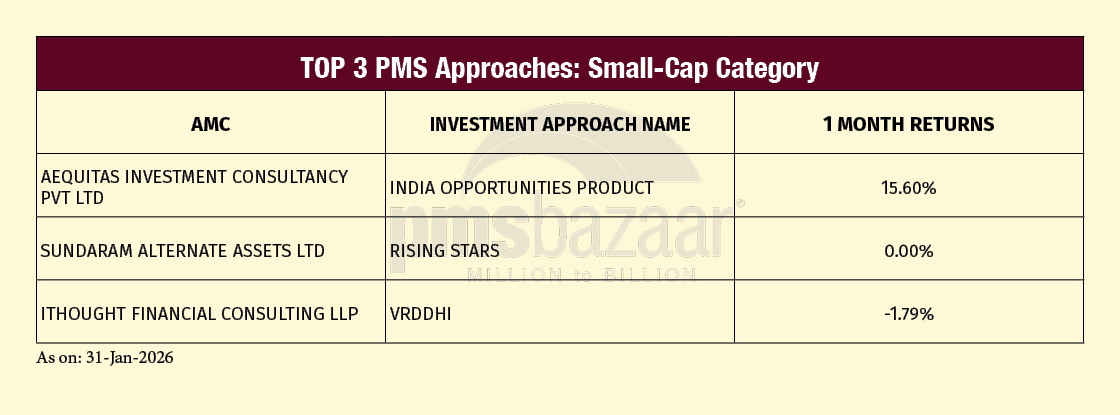
The top of the list shows extreme dispersion even within a stressed segment. Aequitas’ India Opportunities Product (15.60%) topped the category with a strong double-digit gain, a sharp contrast to the bucket’s negative average. Sundaram Alternate Assets’ Rising Stars (0.00%) held flat, while ithought’s VRDDHI (-1.79%) was the next best, managing to contain losses well above the category mean.
In conclusion, January’s smallcap bucket reads like a stress test: broad-based declines with very few strategies beating market benchmarks, yet a single standout return demonstrating how concentrated positioning can still create outliers.
Here is a table on the top performers in this category.
Outlook
February 2026 starts from a cleaner base for PMS investors. January’s drawdown reset a lot of excess optimism, valuations and positioning, especially in the mid/small and thematic-heavy parts of the market. That matters because PMS outcomes are often driven by dispersion: when fear peaks and breadth is still weak, the gap between “forced sellers” and “selective buyers” can widen. This can create entry points for managers who run cash, hedge tactically, or have a ready shopping list.
Going forward, the practical takeaway is to align expectations with the mandate. Large-cap and large & mid buckets typically recover faster when sentiment stabilises; mid/small and thematic buckets can rebound harder, but only after the tape stops punishing risk.
For PMS investors, the opportunity is to use this phase to focus on process consistency, drawdown discipline, and position sizing.
Happy Investing!
Recent Blogs

Understand Why Quant Does Not Replace Fundamental Investing - It Strengthens It
PMS Bazaar recently organized a webinar titled “Understand Why Quant Does Not Replace Fundamental Investing - It Strengthens It,” which featured Mr. Dinesh Giridhar, Co Founder, MD & CEO, Asset Management and Private Wealth, Dolat Capital. This blog covers the important points shared in this insightful webinar.

How to Navigate Micro and Small Cap Sector
PMS Bazaar recently organized a webinar titled “How to Navigate Micro and Small Cap Sector,” which featured Mr. Hemant Gadodia, Founder and Managing Director Invicta Capserv Private Limited. This blog covers the important points shared in this insightful webinar.

June Rewards Active Management in a Range-Bound Market
June 2026 saw a largely sideways market with selective pockets of strength. Small Cap and Small & Midcap PMS strategies led the performance charts, while several active managers continued to outperform the benchmarks through disciplined stock selection.

Where Performing Credit fits in Your Portfolio
PMS Bazaar recently organized a webinar titled “Where Performing Credit fits in your portfolio,” which featured Mr. Vaibhav Porwal, Co-Founder Dezerv and Mr. Sahil Contractor, Co-Founder, Dezerv. This blog covers the important points shared in this insightful webinar.

Early-Stage Access to India's Manufacturing Growth Story
PMS Bazaar recently organized a webinar titled “Early-Stage Access to India's Manufacturing Growth Story,” which featured Mr. Vignesh Shankar, Founder & Managing Partner, a99 VC. This blog covers the important points shared in this insightful webinar.

May sees selective alpha as PMSes navigate market consolidation
Despite a subdued market environment, PMS strategies continued to deliver positive returns. Leadership remained concentrated in Thematic, Small Cap and Small & Midcap categories, underscoring the value of active management and focused portfolio positioning.

SEBI’s Accredited Investor Certificate: Exclusive Access to AIFs, PMS, SIFs & Private Markets
PMS Bazaar recently organized a webinar titled “SEBI’s Accredited Investor Certificate: Exclusive Access to AIFs, PMS, SIFs & Private Markets,” which featured Mr. Rajesh Kumar S, Head of Business, NSDL Database Management Limited. This blog covers the important points shared in this insightful webinar.

April rebound lifts PMS strategies, but small-cap tilt drives leaders
A broad market recovery helped managers beat large-cap indices, though alpha against wider benchmarks remained more selective and category-dependent